
SDG impact measurement background information
Our six-step SDG impact measurement method provides structural insight into our contribution to the SDGs. Below we describe the Responsible Business Simulator, the assumptions we make and the indicators we use. We also provide a visual representation to explain how threshold values and appreciation work.


Responsible Business Simulator
The approach underlying our SDG impact measurement is the Responsible Business Simulator (RBS). This approach and associated tool, developed by PwC in collaboration with Nyenrode Business University, supports strategic decision-making by quantifying financial and non-financial information. This enables us to make informed decisions based on numbers rather than gut feelings.
The RBS allows us to convert the results of indicators with different units (€, %, numbers) into a single unit of measurement. This is how we arrive at impact scores for each SDG. Read more about Responsible Business Simulator.
Assumptions in the method
Impact measurement provides insight into performance, but has inherent uncertainties. For example, for our SDG impact measurement, we make assumptions about thresholds and also when we convert indicators to a single unit. Data availability is also not always optimal.
Threshold values
For each indicator, we choose a threshold value to determine whether there is a positive, neutral or negative impact on the SDGs. Threshold values can, for example, be based on an industry average or a Dutch average.
Conversion to a single unit of measurement
To convert indicators to one unit of measurement, we apply a rating function. Each indicator is given a value between -100 and 100. To do this, we make assumptions, such as the shape of the valuation function (linear, parabolic, etc.) and the minimum and maximum value an indicator can take.
Data availability
Impact measurement depends on data availability. In certain cases, there are limitations. For example, information on gender and cultural background is recorded on a voluntary basis. Therefore, we cannot guarantee full measurement of impact in these areas.

Appreciation graph for Percentage of suppliers that have science-based targets for emission reduction
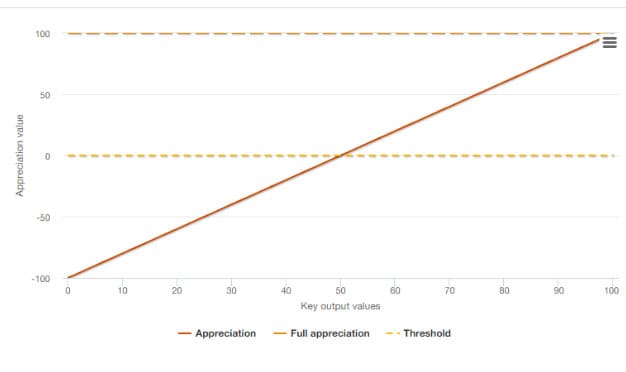
Example of threshold and valuation
How do we apply thresholds and valuation in our SDG impact measurement?
This example, with visual representation, covers our suppliers who have Science-based targets for emission reductions, and therefore our upstream impact on anthropogenic climate change. We measure this as a percentage of total suppliers.
The visual representation shows the rating on the vertical axis and the percentage of suppliers on the horizontal axis. The threshold is set at 50%, in line with the Science-based target initiative. The impact is negative if this percentage is below 50% and positive if it is above 50%. The percentage must be between 0% and 100%, as other values are not possible in reality.
Indicators
For each SDG in our impact measurement, we define a number of indicators. The current indicators and their definitions are listed in the following overview.

SDG 4
4.1 |
Training equality |
4.2 |
Training hours |
4.3 |
Education through PwC Academy |
4.4 |
Evaluation score PwC Academy training |
4.5 |
Academic education |
4.6 |
Engagements contributing to Education |
SDG 5
5.1 |
Gender pay gap
|
5.2 |
People Engagement Index (PEI) |
5.3 |
Gender diversity
|
5.4 |
Gender diversity in leadership
|
5.5 |
Gender diversity in (job) engagement teams |
SDG 8
8.1 |
Financial results |
8.2 |
Well-being
* favourable score is 4 or 5 |
8.3 |
People involved in CS projects Hours booked on pro bono engagements (jobs) for social enterprises (and other organisations with the goal to create shared value [social, ecological and economic]) (#) |
SDG 10
10.1 |
GPS scores I&D
* favourable score is 4 or 5 |
10.2 |
Cultural diversity
|
10.3 |
Cultural pay gap
|

SDG 13
13.1 |
GHG emissions
|
13.2 |
Carbon offsetting and removals
|
13.3 |
Environmental spend |
13.4 |
Taking action on environmental impact |
| 13.5 | Supplier science based targets Percentage of our suppliers that have science-based targets for emissions reduction |
| 13.6 | Energie
|

SDG 16
16.1 |
Integrity
|
16.2 |
GPS score Leadership effectiveness (transparency) * favourable score is 4 or 5 |
16.3 |
Reputation |
16.4 |
Stakeholder dialogue on purpose |

SDG 17
17.1 |
Number of social enterprises supported |
17.2 |
Sponsorships by PwC
|
17.3 |
Investing in financial, volunteering and pro bono services |
17.4 |
Thought leadership and partnership to help solving important problems |
Contact us

Wineke Ploos van Amstel - Haagsma
Chief Sustainability Officer, PwC Netherlands
Tel: +31 (0)65 170 13 44


